A gantt chart is a visual representation of a project’s critical path. Gantt chart software has various features that help you manage your project’s critical path. For example, the software will allow you to automatically adjust the task rate based on client modifications or task leader instructions. The software also allows you to make Task dependencies automated. It also lets you visualize milestones. If you have multiple projects, a gantt chart will help you determine when to make adjustments.
Task dependencies are an integral part of gantt chart software
In order to use a Gantt chart effectively, it is necessary to understand how task dependencies affect each other. A single task that is dependent on another cannot begin before the predecessor has finished. In the same way, no activity can begin before another has completed. This dependency is known as task dependency, and Gantt chart software makes this easy. Here are some examples of task dependencies.
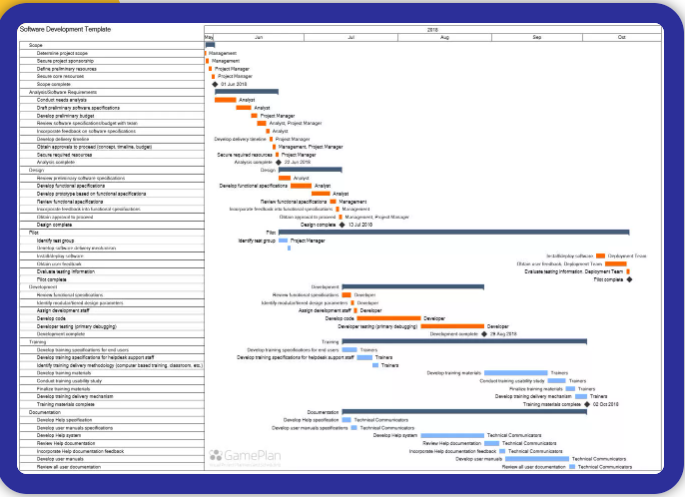
A Gantt chart depicts tasks as horizontal bars. Each horizontal bar represents the duration of an activity. The longer the bar, the longer the duration. Tasks can share dependencies, so a single task can have many predecessor and successor tasks, which tells the proper sequence of project delivery.
Gantt chart
The dependencies between tasks are important, as they can influence the project’s schedule. Gantt chart software allows managers to view the effects of changing tasks by displaying them in a clear and concise manner.
Knowing task dependencies is vital to successful project execution. Without anticipating these dependencies, it will be difficult to plan properly. In other words, task dependencies allow you to make better decisions about when to start a task. In a Gantt chart, if task A has to finish before task B begins, it will appear as a horizontal bar next to task B. Task B can then start when task A has finished, and vice versa.
Modern gantt charts allow project managers to shift tasks around as needed, and task dependencies ensure that every task is connected to its predecessor. Clear communication is crucial in any project, as lack of it can cause projects to run late or even over budget.
Gantt chart software
Web-based gantt chart software helps teams communicate effectively, without leaving anyone out in the cold. These charts can be shared among all team members.
While task dependencies are important in a gantt chart, they are tricky to understand. They are simply relationships between tasks. Unlike the predecessor, the successor cannot start before the predecessor task. Once the predecessor task has started, the successor task cannot. In other words, task A cannot begin until Task B has started, but task B can finish at any time after the predecessor has completed. In rare instances, this dependency is unnecessary.
Milestones are a visual representation of a project’s critical path
In gantt scheduling software, milestones are a way of visually illustrating the crucial path of a project. These stages represent key milestones in the project, and are often marked by a diamond symbol. They mark the completion of a task sequence or phase, and they are often fixed dates. These markers also help ensure that subtasks are completed on time.
A critical path in gantt scheduling software is the connection of tasks that are dependent on one another. When a task falls behind its critical path, it can affect the whole project. This makes it important to include milestones when planning a project. Fortunately, gantt scheduling software has several features that can help you visualize your critical path more clearly.
A PERT chart shows the sequential order in which tasks should be completed. It also allows you to adjust times if circumstances change. This way, the project will always be completed on time. Nodes numbered one to 10 represent tasks and events in a project. Nodes in the PERT chart are linked together by labeled vectors. The direction of each arrow indicates whether the tasks are related or independent. For example, tasks between nodes 1 and 2 may be undertaken at the same time.
The Gantt chart is a tool for organizing a project’s timeline and tasks. The chart can be used by managers or teams to prioritize tasks. Gantt charts also allow project teams to plan the durations of individual tasks. Milestones are important milestones along the critical path of a project. They represent the points in time that will be completed.
If you want to use a Gantt chart effectively, you should look for a tool with a progress bar that shows whether tasks are on schedule or off. A critical path shows the longest path to completion, as well as the most critical tasks. This way, you will know exactly how long a task will take to complete. Once the critical path is established, you will be able to adjust the duration of individual tasks as needed.
Task dependencies can be automat
There are several ways to automate task dependencies in gantt scheduling software. One of the easiest ways is by double-clicking the task to add a dependency. You can also use the right pane to set dependencies. Next, click the drop-down next to the predecessor task to select the predecessor task. Once you’ve added the dependent task, you can edit its dependency type, lag, and finish by clicking the Ok button. The dependent task will now automatically set in the timeline.
Task dependencies
Another type of task dependency is know as a finish-to-finish dependency. With this type of dependency, the initial task has to complete before the successor task can begin. The problem is that this kind of dependency is usually apply to tasks that work simultaneously. Some project management experts debate this dependency, however, and wonder if it’s necessary. If you’ve set up tasks that depend on each other, you need to consider how they will affect the project’s schedule.
Another way to automate task dependencies is by integrating a file attachment into the Gantt chart. This way, you’ll be able to assign each team member a specific amount of hours each day. This way, you can ensure that each team member has the proper amount of time to complete a task. Gantt scheduling software is an excellent choice for many reasons. It allows you to plan your project as it needs to be complete and keeps your team motivate.
Advanced Gantt scheduling software
A Gantt chart makes it easier to manage the logistics of a project. Using a Gantt chart makes it easier to maintain the project’s timeline while ensuring everyone understands what’s important and when. It can be extremely difficult to track the activities of several teams, but Gantt chart software helps make it easier to manage the workload with multiple team members. The software makes it easy to allocate resources to each team member based on the resources available.
Advanced Gantt scheduling software will automatically reschedule tasks based on the slack between the predecessor and the successor. You can see the exact start and completion date of each task without having to manually adjust the Gantt chart. And it’s possible to automate task dependencies by assigning resources to specific people. The software will automatically reschedule tasks as necessary and maintain the original slack between the predecessor and successor finish dates.
Adjustments can be automat base on task durations and project progress
In general, the process of estimating the total duration of a given activity requires a detailed understanding of the specific site conditions and crew composition, as well as the overall productivity and project progress. The calculation of activity durations using Equation (9.1) represents a best-fit approximation of the activity’s duration, and the higher levels represent the attributes that depend on lower level adjustments and calculations. A hierarchy of estimation levels is depict in Figure 9-8. The lowest level estimates the activity’s maximum productivity based on general work co犀利士
nditions. Table 9-4 shows the possible productivity values for each activity in the hierarchy.